Configure a dashboard output
Last updated: July 12, 2026
Configure a dashboard output
Use a dashboard when the answer needs to be scanned, compared, filtered, or monitored rather than read as a long narrative.
Choose the output type
Open the Output step in the agent builder and choose the artifact the agent should produce every run.
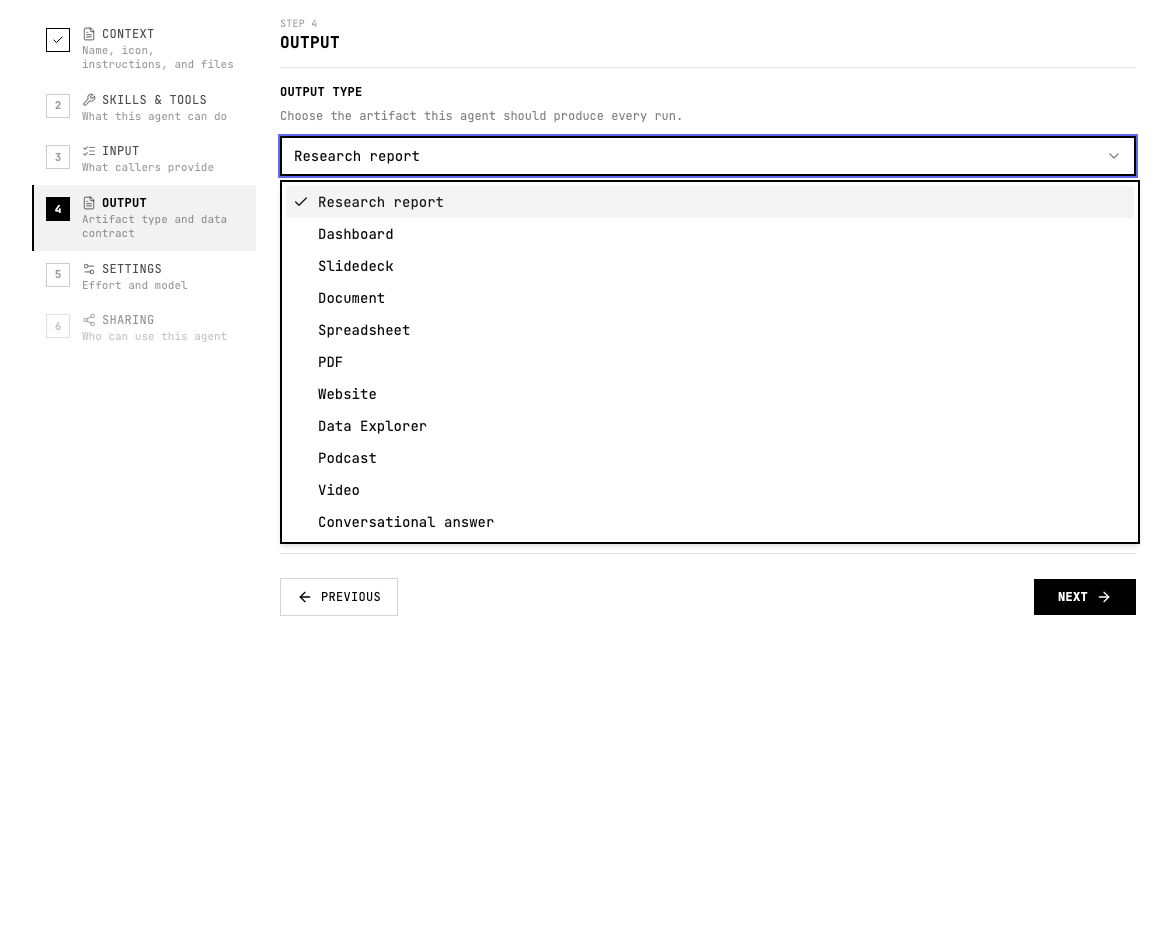
When to use Dashboard
- The agent produces metrics, statuses, flags, segments, or comparisons.
- Reviewers need a repeatable operating view for many entities or cases.
- The output should make trends, counts, exceptions, and priorities obvious.
Configure Dashboard
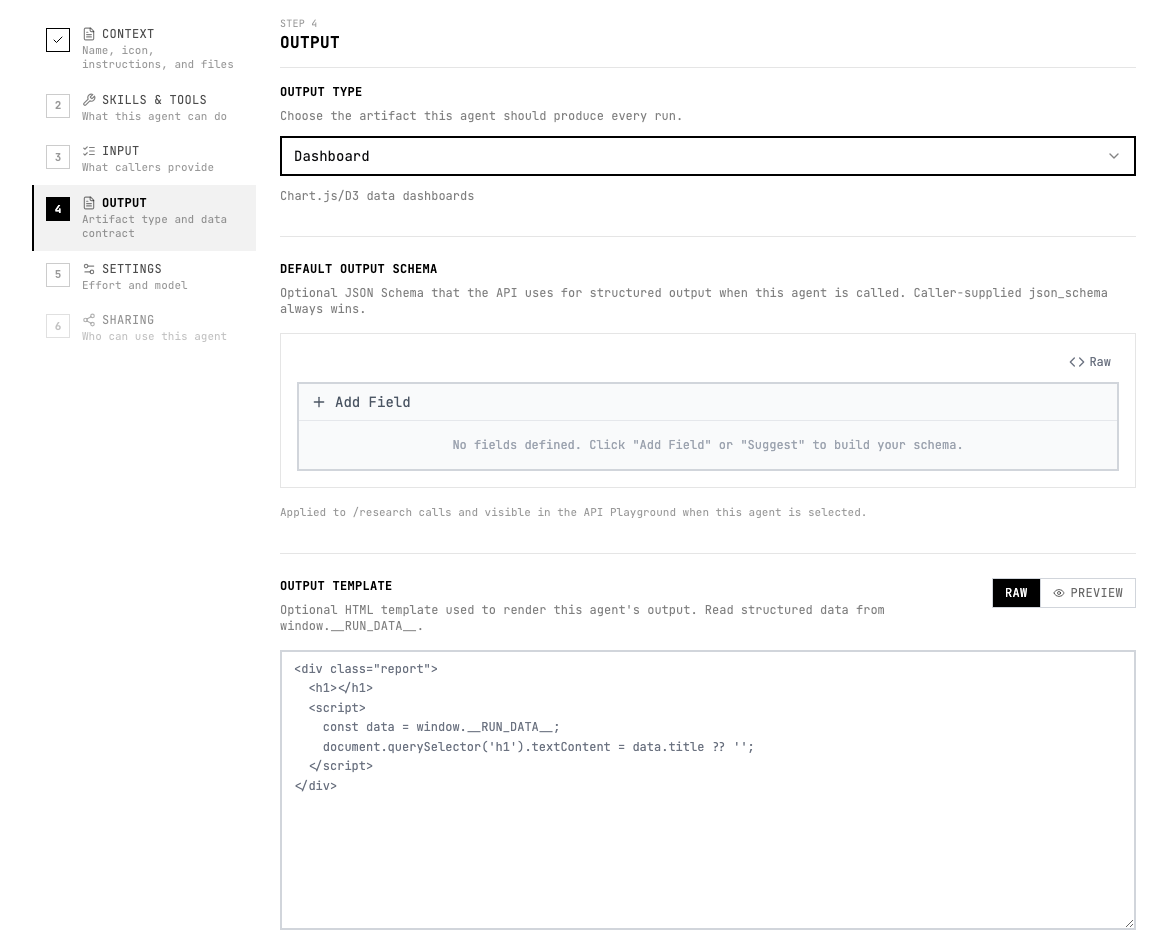
- Choose Dashboard in the output type menu.
- Define the panels the dashboard should contain before running the agent.
- Ask for short labels, metric definitions, and drill-down rows so the dashboard is useful without extra explanation.
Instruction pattern
Add a short output instruction to the agent instructions or the relevant skill so the agent knows what good looks like.
Create a dashboard with summary metrics, priority flags, grouped findings, comparison tables, and drill-down notes for each high-risk item.Quality checklist
- The audience and use case are clear.
- The output format is selected before testing.
- The agent instructions describe the expected sections, fields, or scenes.
- Important claims include evidence or source links.
- The output can be reviewed without guessing what each field or section means.
- If another system consumes the result, the schema and allowed values are stable.